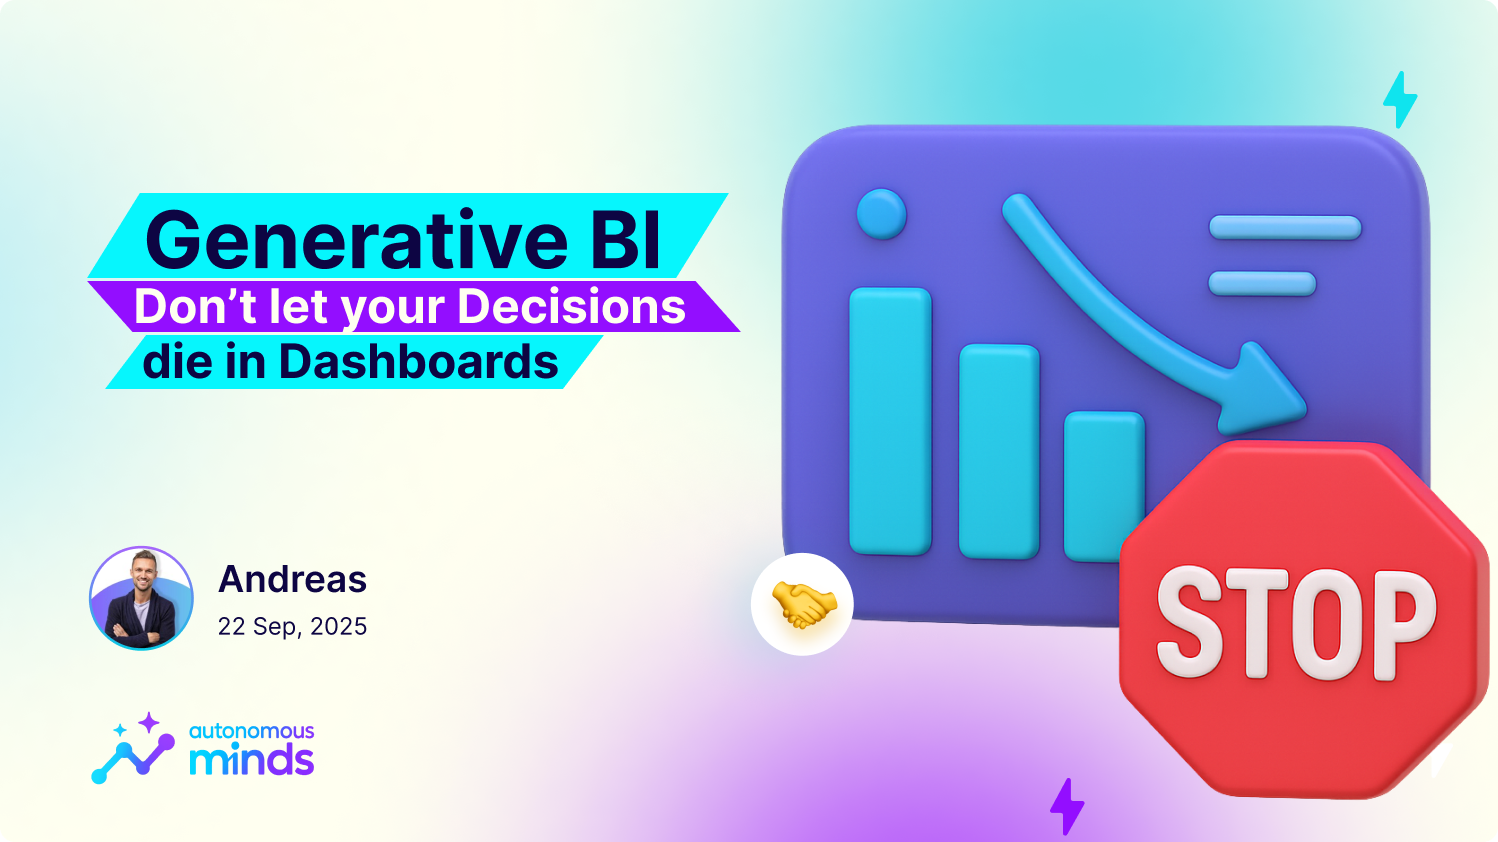
Why traditional BI is stuck in neutral
Dashboards are great at telling you what happened. They rarely tell you why, and they almost never push the next step forward. The result? A familiar loop:
- A metric moves.
- Meetings → screenshots → more analysis.
- By the time you act, the window has closed.
Industry stats paint the same picture: adoption is limited, most requests miss same-day delivery, and a majority of decisions still aren’t backed by data. The bigger problem isn’t visualization, it’s execution latency: the gap between seeing a signal and doing something about it.
Insight without action is expensive delay.
Enter GenBI: Generative Business Intelligence that acts
Generative BI (GenBI) is the next layer on top of your data. It combines LLMs, analytics, and safe integrations so operators ask questions in plain language, get a grounded explanation of why a number moved, and then trigger a policy-guarded action directly in their tools.
Think: What → Why → Done. In Minutes!
The three pillars of agentic GenBI
- Democratize access
Natural-language questions over your warehouse, SaaS tools, and spreadsheets. Build interactive dashboards from plain English. No “BI ticket” required.
- Explain the why (causal analysis)
GenBI surfaces likely drivers with evidence: temporal alignment (what changed and when), feature importance, and known business events (price change, outage, campaign). It distinguishes “looks related” from “likely cause.”
- Trigger actions
With policy-guarded writes, GenBI updates the CRM, creates tasks or meetings, posts a summary, and can even generate a partner-ready PDF or PowerPoint, with an audit log of who/what/when.
How agentic GenBI works (without the magic dust)
- Connect your data sources (warehouse + a few apps) and capture basic business context (important fields, environments, guardrails).
- Ask in plain language (“Why did churn spike in July?” “Which stores benefit most from rain?”).
- Explain with evidence: “Churn ↑ after the July 1 price change; failed payments ↑ in EU; effect strongest for Pro plan.”
- Act with a click (or automatically under policy): “Flag at-risk accounts, create owner tasks, post Slack summary, generate PDF for the leadership team.”
- Audit & learn: outcomes are tracked, actions are reversible, and the system gets smarter.
Important: Causal explanations are evidence-based hypotheses until actions validate them. Good GenBI systems show their work and measure outcomes (Evals).
Concrete examples (so you can picture it)
- Revenue operations: Pipeline coverage looks thin. GenBI compares cohorts and explains: “Win rate dipped where competitor discounting overlapped with rep attrition; touches/week fell <2.” It then creates a “QBR touch” task sequence for affected deals and posts a summary in Slack.
- Risk & operations: Late-night spike in transactions. GenBI explains: “Deposit velocity 3.1× after promo; geo-mismatch vs prior device fingerprint.” It recommends capping limits for a cohort, enabling 2FA on suspect devices, and generates a customer-ready PDF.
- Retail & FP&A: Sales jump in Week 28. GenBI separates promo lift from weather effects, shows which stores gain from rain, and recommends shifting inventory and staffing. It opens two tasks in the ops board and emails a one-pager to store managers.
Each example ends in the tools where work happens—not in another meeting about a screenshot.
Why this is different from “chat over data”
A chat UI alone isn’t GenBI. Three things make it agentic:
- Context-aware: understands entities (accounts, stores, tickets), not just columns.
- Causal mindset: reasons about timing and mechanisms, not just correlations.
- Actionable: safely writes to systems with RBAC, scopes, and approvals.
Without these, you have a helpful assistant. With them, you have a force multiplier.
Governance: trust before speed
Speed matters. So does control.
- RBAC & scopes: who can ask, who can approve, what fields GenBI can write, down to record level.
- Approval workflows: auto-execute under threshold; require human sign-off above it.
- Audit trail: every action is logged (who/what/when), with instant rollback if needed.
- Data boundaries: encryption in transit/at rest, least-privilege credentials, and clear data-residency options.
- Reliability: backoff and queuing if downstream APIs (e.g., CRM, Slack) are unavailable; nothing is “fire and forget.”
Governance turns “AI that acts” from scary into operationally credible.
What you need to get started (and what you don’t)
You don’t need a perfect warehouse or a PhD lab. A practical path:
- Connect 2–3 sources (warehouse + CRM + messaging).
- Define 1–2 playbooks (e.g., “explain churn and flag accounts,” “find SLA breach drivers and open follow-ups”).
- Set policies (who can trigger what; write scopes).
- Ship one “why + action” flow in a week; iterate based on outcomes.
The point isn’t to boil the ocean. It’s to shorten time-to-action on one valuable problem, then repeat and grow quickly.
How to evaluate a GenBI platform
- Does it show its work? Evidence for the “why” (time windows, driver contributions, known events).
- Can it act safely? Guardrails, approvals, audit, reversibility.
- Does it fit your stack? Connectors, identity (SSO/OAuth), and deployment model.
- Can non-technical teams use it? Real plain-English prompts, saved analyses, shareable links.
- Does it learn? Feedback loops, reusable playbooks, outcome tracking.
If any of these are missing, the “action” part will fall back on a human, and you’re back to dashboard purgatory.
The payoff: pro-activity, fewer meetings, more receipts
When GenBI is working, you’ll notice receipts, not decks:
- “27 accounts flagged • 27 owner tasks created • Summary posted to #revops”
- “Risk report emailed to customer • Audit ID #A-10393 • SLA follow-up opened”
- “Staffing shift recommended • 8 stores accept • Wait times ↓ 18% week-over-week”
That’s how you know you’ve moved from what to why to done.